How to Use Analytics (Brands)
Last updated: February 19, 2026
What can I use Analytics for?
Brands can use the Analytics dashboard to monitor key metrics like # of orders, average completion time, and ASN timeliness across configurable timeframes.
How do I see Analytics?
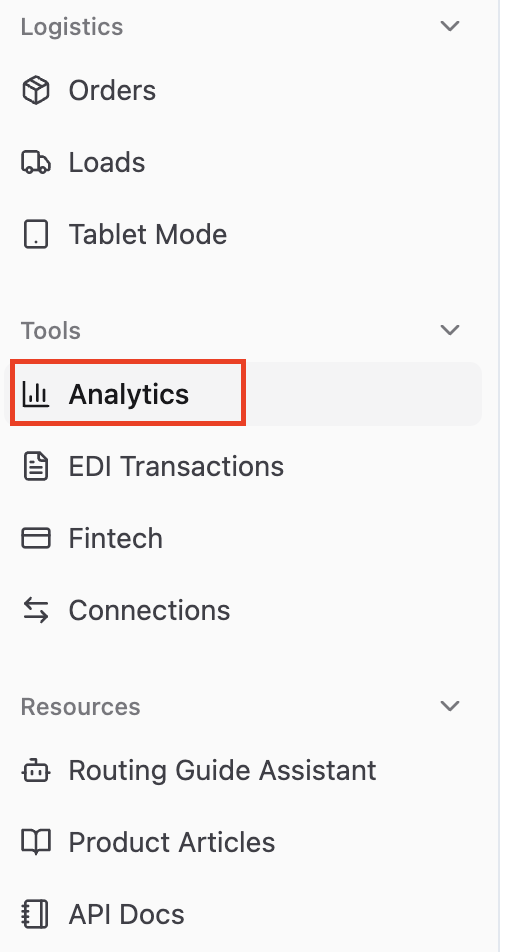
Navigate to 'Analytics' under 'Tools' on the left hand side of the RetailReady Toolbar.
Use the 'Filters' icon underneath 'Analytics Dashboard' to configure how you would like to view your data.
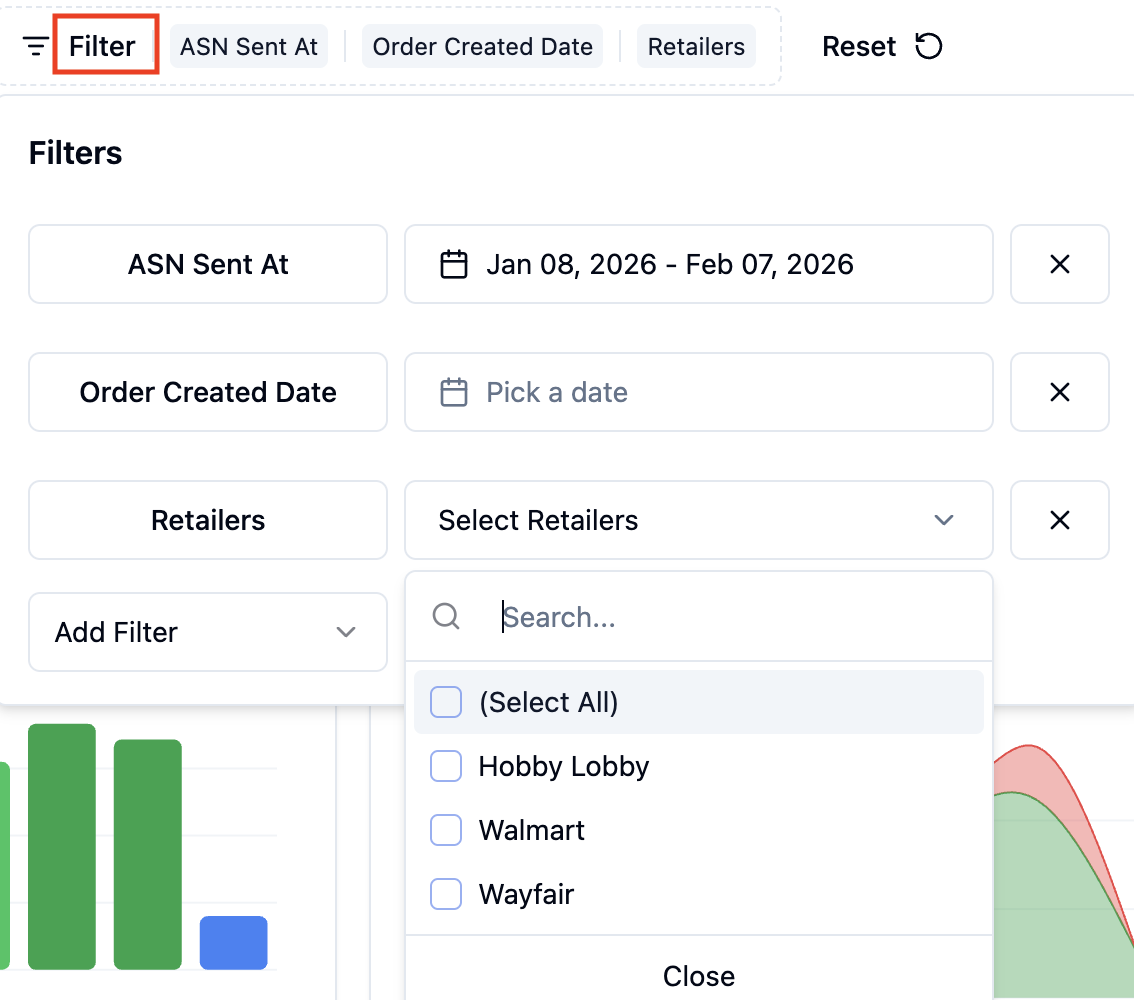
You can configure a number of data elements to create subsets of data to analyze, for example:
When the Order was created
Which Retailers you are shipping to
When the ASN was Sent
Once your Filters are complete, just re-click the 'Filter' icon to then view the Analytics.
How to interpret the Analytics?
Once you have your filters configured, you can use the Analytics Dashboard to analyze different trends for your order shipping performance.
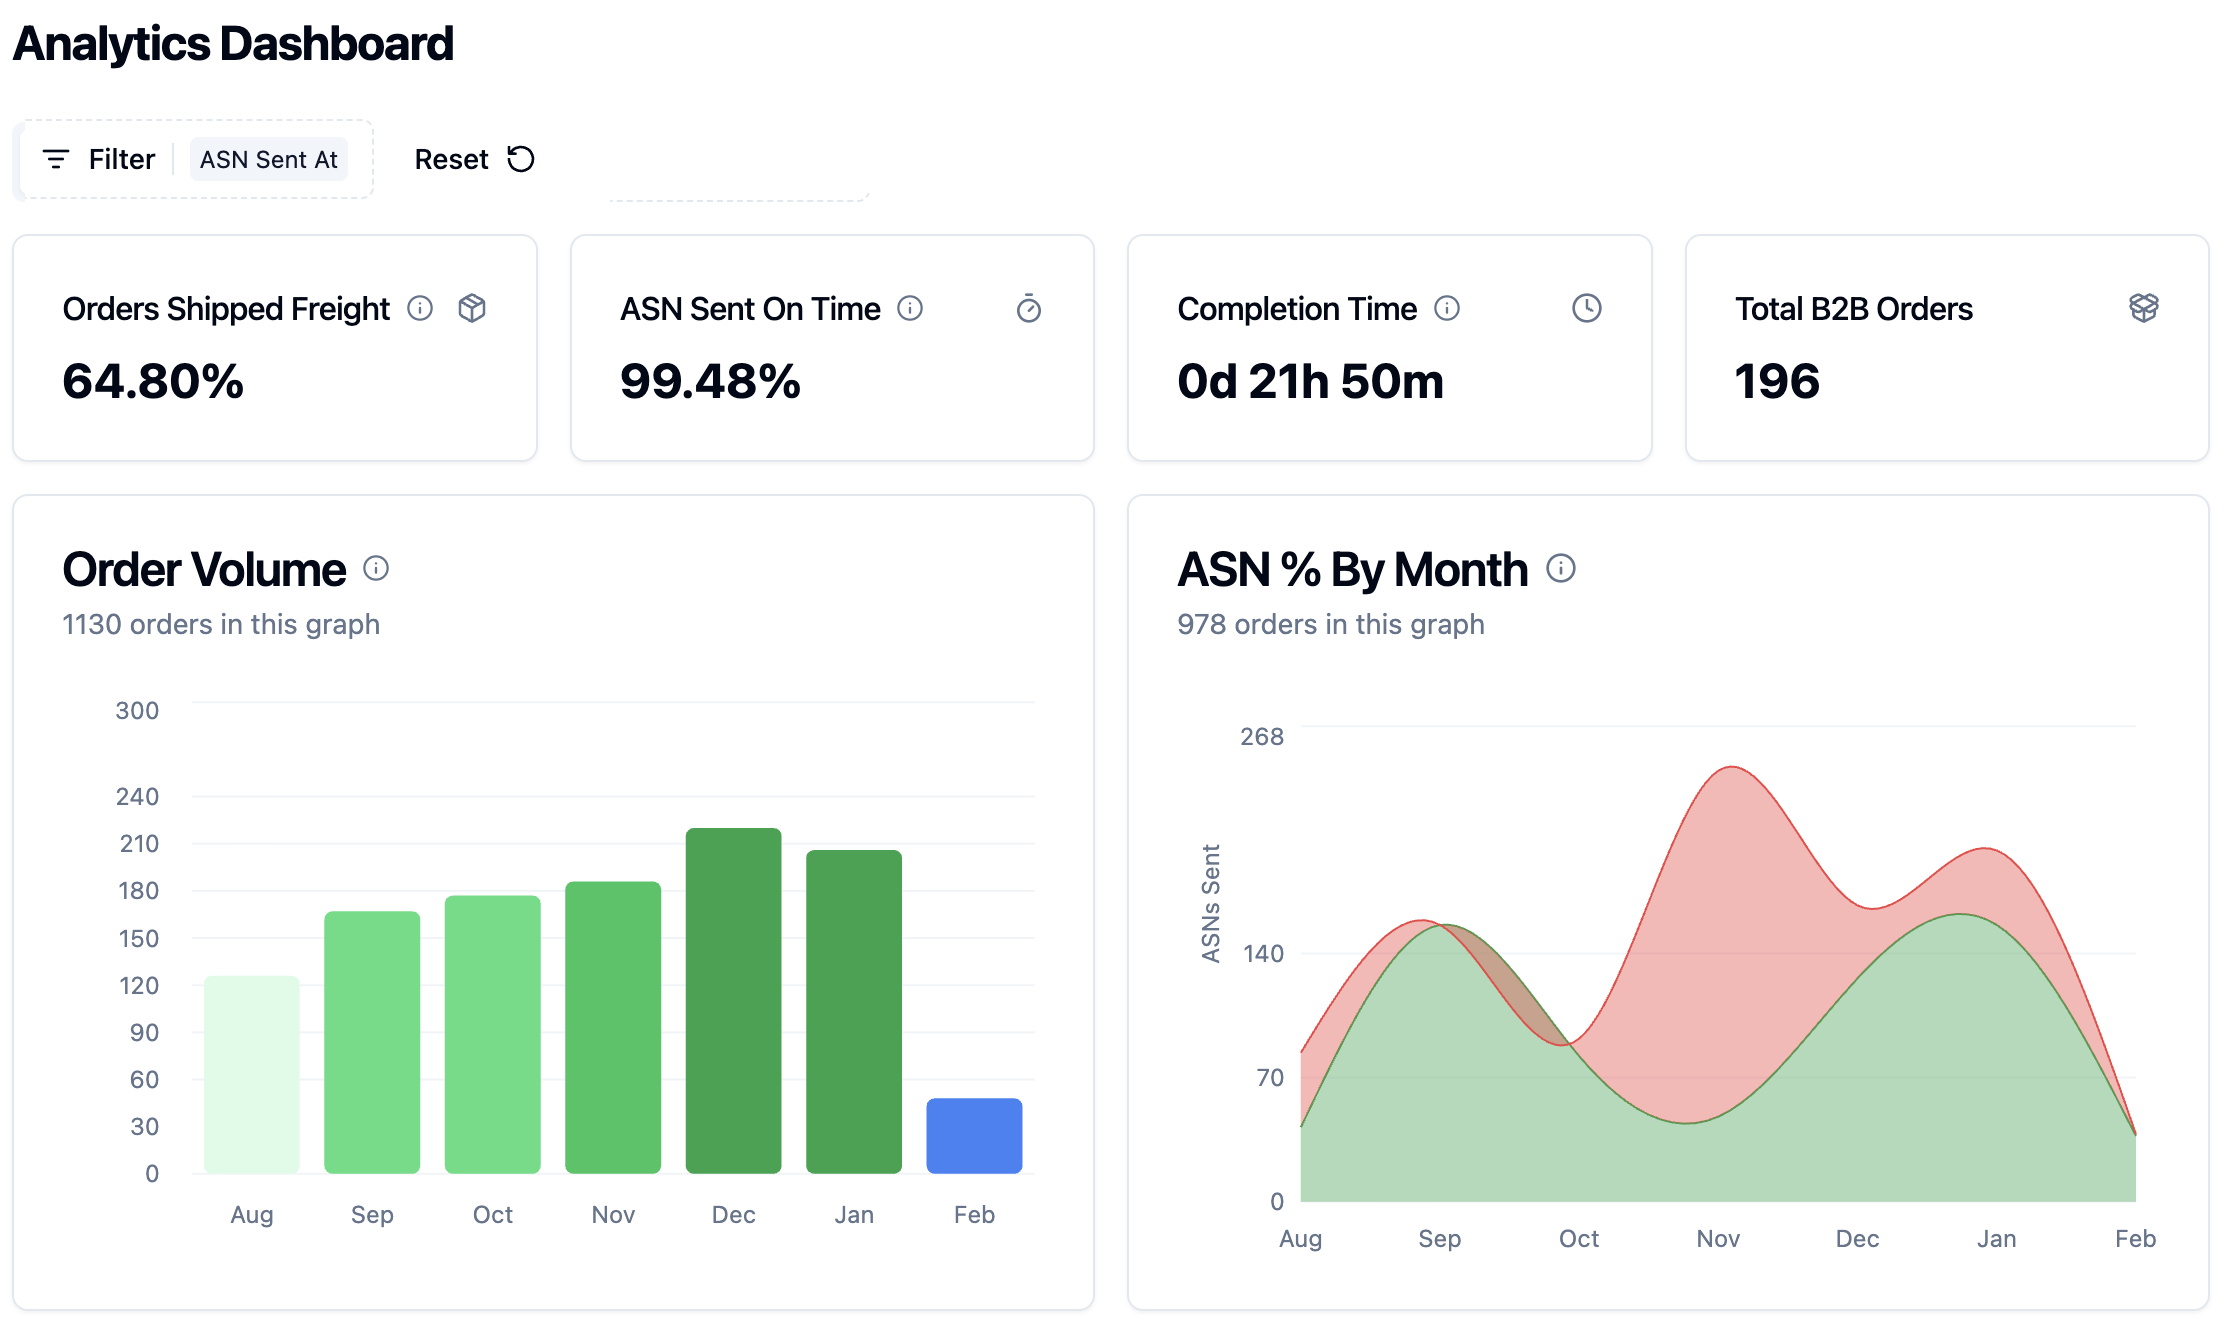
Specifically, key metrics will display for % of Orders Shipped Freight, % of ASNs Sent On Time, Average Completion Time, and the Total # of Orders in your filtered timeframe. Use the hover icons next to each metric to learn more about what the metric indicates!
ASN Sent on Time tracks if the ASN was sent on or before the latest date provided by the Retailer.
Completion Time is calculated as the time between the first carton created to when the ASN is sent.
Additionally, you can view trends for Order Volume and ASN % On Time by Month over a longer, extended timeframe.
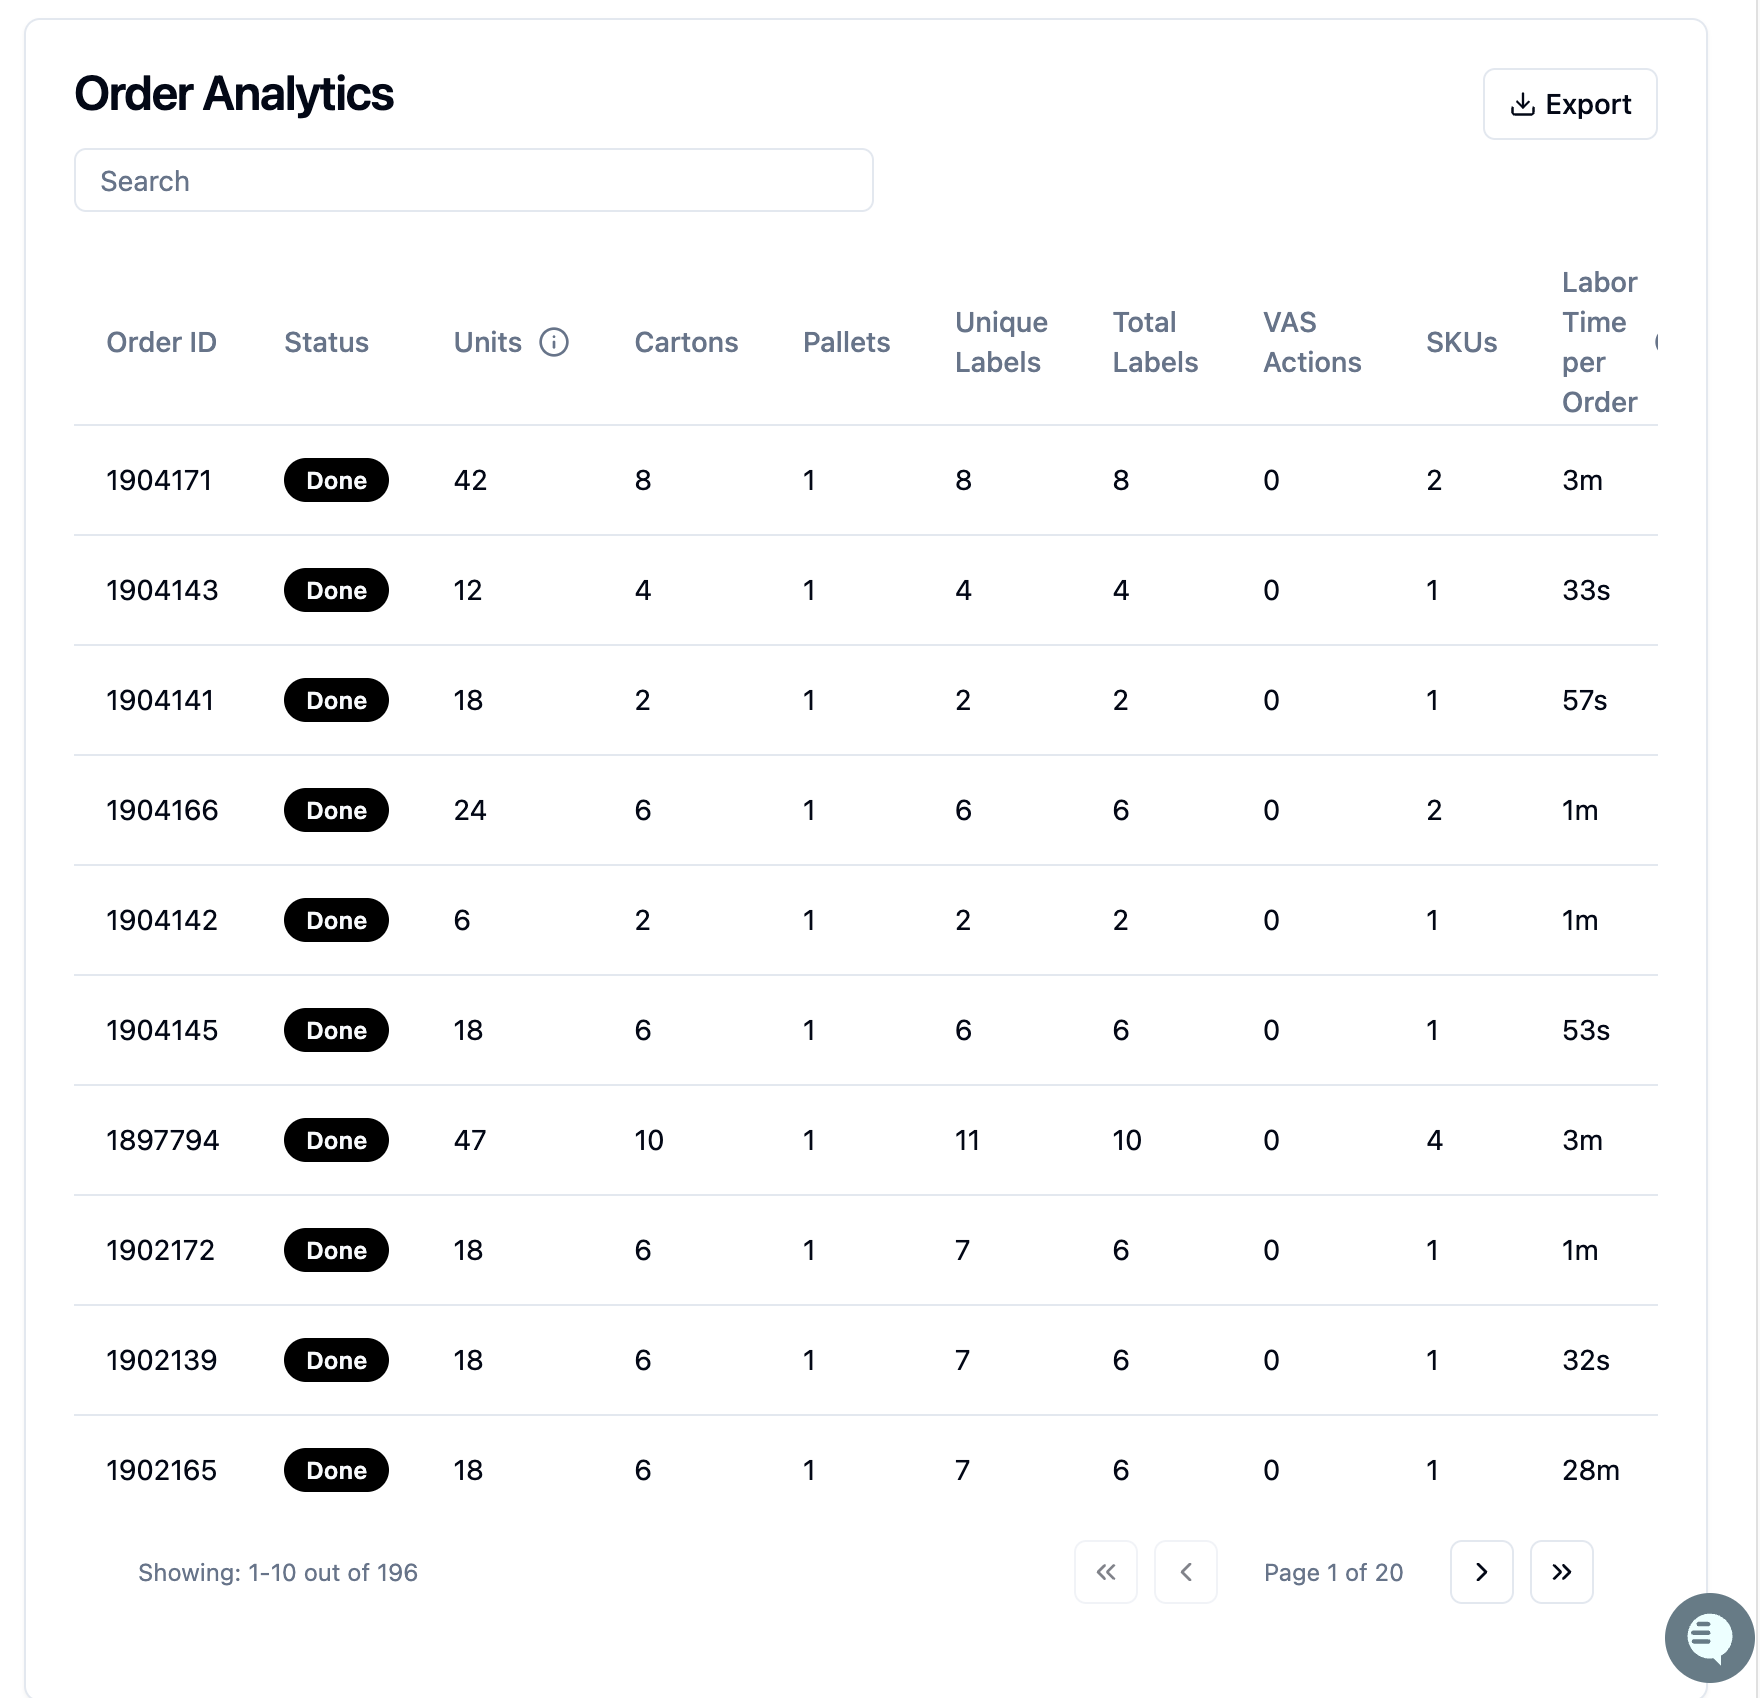
Finally, you can view and export Order-level information that is contributing to these analytics in the Order Table displayed below the metrics.